

In the second part of this two-part interview series Carleigh Morgan interviews Jussi Parikka about Burak Arikan’s work, discussing the way data and networks condition and construct the way we view and interact with the world. The first part of the series, an interview with Burak Arikan, can be read here.
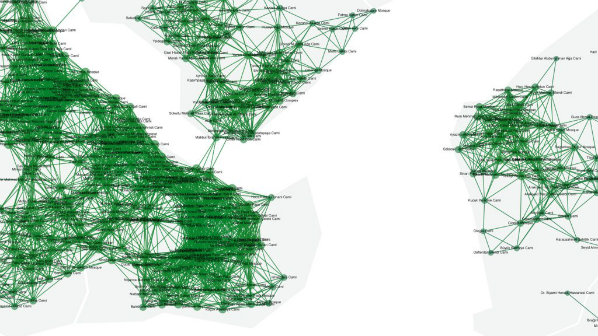
Burak Arikan is one of Turkey’s leading media artists. Through his practice he maps relations of power and invisible infrastructures using network mapping tools. Arikan’s Graph Commons, an online network mapping tool, is an open platform for the creation of networks that encourages its users to explore the functional limits of network architectures as a mechanism for storytelling, data visualization, and modelling our contemporary moment, from graphing financial microtransactions to mapping superstructures splayed across a continent.
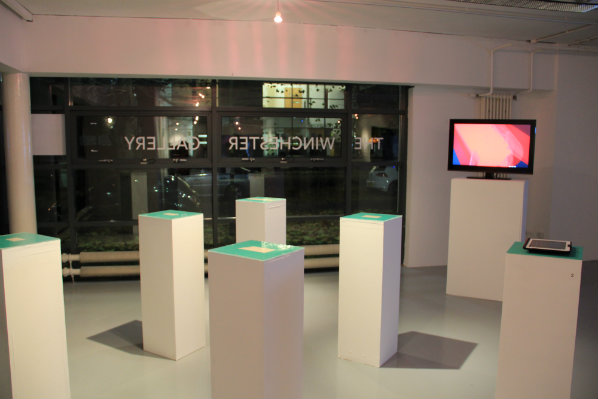
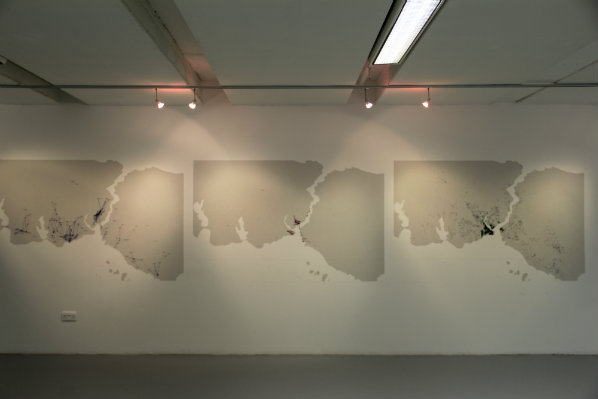
Arikan’s most recent body of work, Data Asymmetry, was hosted at the Winchester School of Art from November 10-24, 2016. The exhibition was curated by new media theorist Jussi Parikka (Professor in Technological Culture & Aesthetics at Winchester School of Art) who comments on the themes, provocations, and challenges that this show invites its audience to consider.
CM: In your essay New Materialism as Media Theory, you conclude: “I propose a multiplicity of materialisms, and the task of new materialism is to address how to think materialisms in a multiplicity in such a methodological way that enables a grounded analysis of contemporary culture. Such methodologies and vocabularies need to be able to talk not only of objects, but also as much about nonsolids and the processual…so we can understand what might be the specificity of this brand of materialism that we encounter (but do not always perceive) in contemporary media culture.”
Are network visualizations like those in Burak Arikan’s art practice—for example, Islam Republic Neoliberalism, which organises data collected about the urban infrastructure—one way to capture the materialism that “we encounter but do not always perceive”? Are networks as a vocabulary sufficient to do this, and are these limitations to Burak’s methodologies that alert us to this kind of multiplicity of materialisms that cannot conform to the network graph?
JP: The network is one form of seeing the world; it gives one form to things we might sense around us as intuitively present even when we are not sure how to express that. The network is not necessarily an end in itself but one particular frame through which to map things – such as urban transformations, architectures as they pertain to our lived experience – and allows you to put yourself on that map. I don’t see networks as an overarching ontology but as a methodological entry to those relations that then scale on other levels too: experiences, narratives, etc. What’s interesting is how Burak’s work plays out this network relationality not only as a visual reality to be looked at, but as a collective form of doing: how to build a network through workshops, or how to express things that we feel crucial to our existence, especially in some of the more politically oriented activist works.
CM: Networking mapping seems to cover a range of modes: cultural epitome, critical methodology, data visualisation tool, a kind mediation narrative etc. Is there a danger to the multiplicities and modalities of representation that networks capture, namely a danger of being misused or misunderstood?
JP: I remember earlier discussions with Benjamin Bratton where we discussed “big data apophenia”: a particular sort of disorder that is conditioned by data: namely, to see relations and to establish them, even if they are not necessarily as real as one can infer from data. The same thing pertains to network methods: you could use it as a pataphysical tool as well to create imaginary worlds of relations, to offer causalities across logical relations, and to create as such a speculative alternative world. Oddly enough, this is exactly something that speaks to the now hot topic of “post truth politics”: how to manipulate and cater data and “information” in ways that becomes effective whether true or not. We are in any case talking of such methods than can be mobilized for multiple uses.
CM: “To produce maps is a method of mapping power, addressing by visual means the asymmetry that defines our situation. Not only asking where we are, but inquiring: where is our data and who owns your data trail? This exhibition maps the shift from information asymmetry to data asymmetry, where aggregation of data is where contemporary power lies.”
Do you see network mapping as inherently emancipatory? Is the need to orient oneself via networking mapping also an exercise in self-reflexive targeting, one that uses modes of surveillance and data capture in an attempt to evade those same modes of capture executed at the level of the corporate-state nexus–is this a contradiction and a risk worth taking in order to achieve an orientation within our own data?
JP: It’s a great point—and demonstrates the paradoxes in this sort of activist work. It’s pretty much a necessity to engage head on and inside such techniques to understand their work: the critical distance often required in institutional or political critique is not really sufficient if we want to understand data culture. We need to be able to work inside such techniques and data, also institutions, in order to be able to shift, transform and manipulate those tools to other ends.
CM: Any other comments on the Furtherfield show and Burak’s body of work?
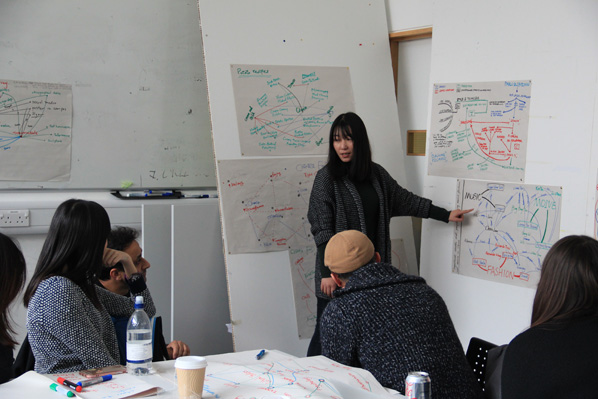
JP: For us it was a really pleasurable opportunity to bring an internationally known artist’s work to Winchester Gallery, and exhibit work that is at that interesting triangle of activism, contemporary media arts and issues that we discuss in media and network studies. Hence while the exhibition was on in the gallery, we also wanted to expand it into other forms of work that build on our earlier collaborations, like at transmediale where we also had Burak as our guest. We also introduced his work into workshops we organised in Winchester and London. It’s this sort of dynamic exchange that also make his works alive: his practice does not merely look at maps and visual relations of data, but also engages, understands, and uses them.
—
Burak’s visit was part of our AHRC funded project Internet of Cultural Things but also our new research group, or office “AMT”: Archaeologies of Media and Technology.
Burak Arikan’s most recent body of work, Data Asymmetries, was hosted at the Winchester School of Art from November 10-24, 2016. His network mapping tool, Graph Commons, is viewable here.
*Inline image photo credits: Olcay Öztürk
Feature image: Winchester School of Art Exhibition of Data Asymmetries. Image Credit: Olcay Öztürk
Burak Arikan is one of Turkey’s leading media artists, a figure who straddles the lines between technologist and practitioner. He explores relations between data and transactions, the regimes of datafication and identification as control, and maps relations of power and invisible infrastructures with network mapping tools. According to new media theorist Jussi Parikka, Burak’s pieces “raise questions of the predictability of ordinary human behavior with MyPocket(2008); reveal insights into the infrastructure of megacities like Istanbul as a network of mosques, republican monuments and shopping malls (Islam, Republic, Neoliberalism, 2012); remap and organise recurring patterns in the official tourism commercials of governments with Monovacation (2012); explore the growth of networks via visual and kinetic abstraction with Tense (2007-2012); and showcase collective production of network maps from the Graph Commons platform.”
Burak’s creation of the Graph Commons, an online network mapping tool, is an open platform for the creation of networks that encourages its users to explore the functional limits of network architectures as a mechanism for storytelling, data visualization, and modelling our contemporary moment, from graphing financial microtransactions to mapping superstructures splayed across a continent.
Burak Arikan’s most recent body of work, Data Asymmetry, was hosted at the Winchester School of Art from November 10-24, 2016. His network mapping tool, Graph Commons, is viewable here.
In the first of this two part interview series, Carleigh Morgan speaks to Burak Arikan about his practice. In the second part of the series Morgan interviews Jussi Parikka about Arikan’s work and the way data and networks condition and build the way we view and interact within the world.
CM: The aim of the Graph Commons is to “empower people and projects through using network mapping, and collectively experiment with mapping as an ongoing practice.” But every visualising methodology has its hermeneutical blindspots and invisible shortcomings.
With those boundary constraints and affordances in mind: What are networks in art, and how are they are extensions of or departures from the networks that they attempt to depict?
BA: I use network as a map vs network as an event separately in my work.
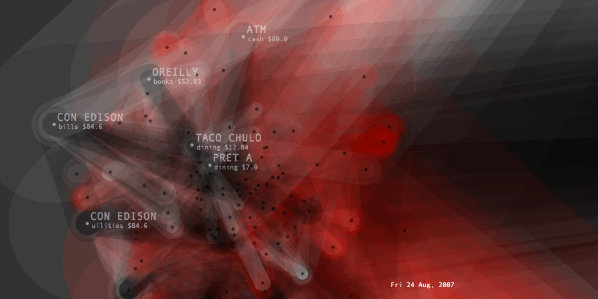
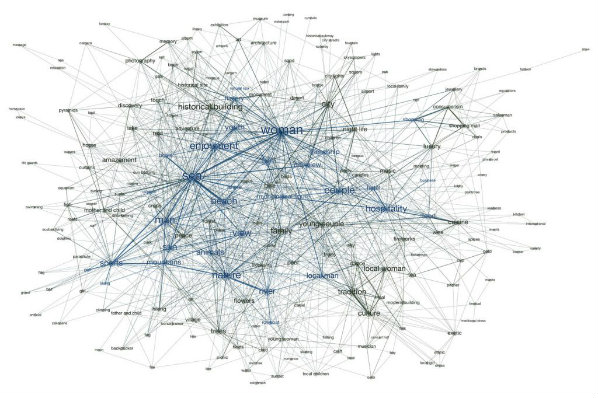
Network as a map is simply using dots and lines to represent observed or measured relationships in order to explore the structures of rather complex systems in life. For example, I am interested in revealing the institutionalization without walls in the world of art, so I look at relationships of artists exhibiting together with other artists, art institutions related by the artists they show, influence of collector-artist relations etc. Such network mapping reveals central actors, indirect connections, organic clusters, structural holes, bridging actors, outliers etc. Network mapping provides a view of such qualities about that particular art world that you wouldn’t see otherwise.
A network map is both a visual and a mathematical language, that you can visually follow dots and lines with your eyes, as well as apply calculations on this data diagram. When you simply record and measure activities as data points, then you can link them to generate more insight and value from the linked whole than the sum of its parts. This is typical data linking method is commonly employed in security, marketing, finance, and social media industries by governments and corporations. One position I have in my art is to use such data mapping and analysis capacity on power relationships, mapping the ones who are mapping us. No need to say, my work is not necessarily about the internet of art things, but I’ve been interested in revealing the relations at scale in variety of fields ranging from juridical systems to cinematic languages.
Network as an event is a living substrate, it is people hanging out together, machines transmitting data packages, neurons firing signals, online platforms for social networking, physical ecosystems of humans and animals where widespread infectious disease can occur. These are physical, digital, hybrid living and multilayered systems maintained by diverse interactions between independent agents, where their small interactions governed by certain protocols together constitute an ever changing larger whole. Building a living network, or network as an event is another line of effort I’ve been pursuing in my work. For example, in 2007 I’ve built Meta-Markets, an experimental online stock market for trading social media profiles, where users did IPO (Initial Public Offering) their profiles and traded with others, with a goal to evaluate the value of a social media profile, the information you cannot get from the service provider company. It ran for 2 years and a community of members formed a dynamic trade network among a couple of thousand social media profiles.
CM: What types of agencies do network maps engender their makers with, and what kinds of constraints to they bring to bear on their creators? As an artist who works with the form of networks, have you witnessed a formal re-alignment of your thinking to reflect these structures? Through ongoing interrogations with and construction of networks as an aesthetic model, would you consider yourself more alert to the networks that condition our contemporary moment?
BA: As with any research, network maps are subjective too. Because by just measuring a reality you claim a subjective position. Thus, data points are always generated, rather than collected. Furthermore, network diagrams are usually totalizing and contemplative. As McKenzie Wark writes criticizing Frederic Jameson’s cognitive mapping: network maps freeze into a contemplative totality that prescribes an ideal form of action that never comes.
My network mapping work starts with raising new questions on critical relations that scale. Then I conduct research to generate data about a “particular world”, which enables many stories, interpretations, and use cases.
As a response to the lack of the “dialectical” in the frozen totality of static diagrams, I started using algorithmic interfaces in my installations. Such interactive network maps let you touch and change the positions of the dots on a map, yet browse the names without losing their relationality to each other as the software simulation continuously organizes the network layout. This way, normally invisible relations not just become visible, but also touchable, which enables us to effectively explore the chain of influences and relationality at scale. Touching the nodes also displays information cards, where you can get richer information about individual data points. By using an algorithmic interface you navigate back and forth between an abstract large picture and concrete juicy details of a complex issue. I think such encounters help the viewer to effectively interrogate the particular issue at hand and develop better insight. This aesthetic and pedagogical experience of interactive cartography is very different from a static diagram, that still lacks criticism.
CM: There’s a resounding common thread in your work [the mapping of the urban infrastructure of Istanbul in terms of its mosques, malls and national monuments in Islam, Republic, Neoliberalism demonstrates this clearly] that seeks to articulate the imbricated matrices of politics, art, and the practices of everyday life that are often not apprehensible to the individual occupied with the attention-consuming projects of being and living.
How does your work position the actor within the network, and what kinds of political commitments do you see expressed from your position as the authoritative designer/person who captures these networks in artistic form?
BA: Since a network map provides a world rather than a story and is thus a nonlinear medium, there is no flow of introduction, development, and finalization, neither a single story. So you start exploring a network map from a “you are here” point, a familiar name or an interesting image, which may be different for every other viewer. Then you do an unplanned journey through a topology of connected information points, navigate from one connection to another. You experience a traversal, a situationist dérive on a data network.
In my workshops and lectures I tell people not to use network mapping against themselves. Network mapping is a powerful tool, it makes structures transparent. Keep the maps about yourself to yourself. Turn it around and map the ones who map you.
In fact, when you click on a follow button, swipe a metrocard, or use your credit card your data is being captured and mapped by data-driven oligarchies. Obviously, this is not just a concern of privacy violation, in this day and age, data capturing is about ownership and control, thus capital and power.
CM: MyPocket generates data from bank transactions, Monovacation from tourism commercials, Islam Republic Neoliberalism organises data collected about the urban infrastructure, Tense Series generates semi-random numbers and uses it as data.
How does your work foreground how data–as algorithmic material that exists at the level of computation, below the thresholds of human apprehension– conditions and structures the world we live in?
BA: Data about us, metadata, make our everyday behaviour more predictable. No one wants to live such a boring predictable life. In MyPocket (2008), by predicting and publishing what I will buy every other day, I demonstrated how easy it is to algorithmically predict our mundane behavior. With this work, in a way I sacrificed myself by making my data no more exclusive to a bank but available to anyone else, so that you can start thinking what corporations can predict about yourself and what it might mean to you.
By turning data around, we can reveal systematic yet invisible power structures. For example in 2012, I mapped a network of Istanbul’s 3000 mosques based on their overlapping call to prayer sounds. Most people living in Istanbul are born into this and take it for granted. However, the mosque network constitutes a subtle power structure, which became quite apparent to many as the government used this network to make calls to city squares in the days following the coup d’etat attempt on July 15th, 2016.
In most of my mapping work, I simply investigate data about one critical relation that connects many agents and constitutes more power as it scales. When completed, a data network is formed and I put that particular world to use.
CM: MyPocket discloses your personal financial records to the internet public by exploring essential patterns in your transactions and deploying software to analyse those transactions. The software, which predicts future spending, sometimes determines your future spending choices. Mark B Hansen calls this a “feed-forward” relationship—one where statistical forecasting, future prediction, and probability calculation can code user behaviour “ahead of time,” framing the future-oriented choices of a subject.
What is an example of a consumer choice you’ve exercised that you were directly influenced to make by this software prediction? Did knowing that your personal financial data was being tracked impact your financial management or change your spending behaviors at all?
BA: MyPocket software was able to successfully predict when and where am I going to buy coffee. It predicts ordinary futures. Our lives have such repetitive patterns, which are not so hard to guess right for a supervised algorithm. With MyPocket, I put myself in an experiment of living under excessive forecast about my everyday purchasing behavior. Would I change my habits, would I abide by the predictions, would I care, would I notice, would I ignore? All of these applied at various stages as I lived with this software system for 2 years.
Today, protecting your privacy is akin to quitting smoking or exercising a vegan lifestyle. Changing habits is clearly hard, but once it starts rolling, it causes a big positive change. I believe, in a society of control that monitors, simulates and pre-mediates individual identities in relation to their data trails, behavioural dissidence is superior to reactionary resistance.
CM: You are an artist and technologist. Does one of these identities emerge more frequently in your work? Did your programming skills drive you to explore the aesthetic possibilities of networking mapping? Was there a sequential logic to your artwork as a secondary and subsequent extension of your work in the computational sphere? How do you situate your artistic practice—one that is reliant on a high degree of technological literacy—to the tools of computer technologies?
BA: My art making is a subjective exploration raising questions, whereas my tool making always wants to be objective, tapping an issue with a solution. I practice them in parallel and they feed each other. Making tools helps me examine all kinds of infrastructures closely thus provides lenses for new questions in my artwork. Artistic inquiries help me change my beliefs about the world.
In the first class of an introduction to computer programming course at MIT, students are told that programming is unrelated to computers in a way that geometry is unrelated to geography. Mastering programming takes years. In fact, in my very early work, technology and algorithms had authority on the outcome, whereas later works have been freed from technological capacities.
BA: Do you find that the procedures for mapping with non-digital tools change your artistic strategies and the types of networks you produce? In a similar vein, is the medium of Graph Commons as a digital interface important to the co-collaborative possibilities that this online platform enables? Would you describe the network mapping that Graph Commons enables as an act that is inherently political, or aligned with activist models of representation?
BA: I always start modeling an idea by sketching on a paper, by discussing with people, by taking notes here and there. It is often a contemplative process that I don’t find possible in a digital tool. As the idea gets mature, the amount of related material might not be manageable on paper – then I start organizing it using digital tools, write some code to scale it and observe its extents.
Obviously, digital tools on the Internet are best for asynchronous communication. The Graph Commons data mapping and publishing platform is great for internet-scale data mapping collaborations. Network mapping particularly is a powerful tool, it makes things more transparent. So activists, journalists, researchers, and civil society organizations around the world use it to untangle complex relations that impact them and their communities.
CM: Do you see networks as maps? Monovacation seems to deploy features of both in its networked parody of the commodity forms and repeated images that characterize the tourism commercial as a typology. What are some key distinctions that might separate these two forms from one another in their attempts to frame, visualize, and enclose data?
BA: As I mentioned earlier, I use network as a map vs network as an event separately in my work.
Monovacation introduced network traversal as a method to deconstruct and explore movies as databases. The official tourism commercials of countries in competition with each other have been selected and each film has been divided into the possible tiniest clips. The 3-4 second long clips have been coded with tags. Tags with shared clips are connected to each other (weighted with number of clips) on a network diagram, which runs as a self-organizing software simulation. A new movie has been algorithmically generated through a traversal on this network map, a program navigating from one node to another, following the weighted path among the tags. Seashores from Egypt to Portugal, women from Israel to India, mythological figures from Thailand to Turkey formed an extracted fantasy of “vacation”.
CM: The Graph Commons platform contains an additional axis that static graphics do not: time. How does working within digital media open up new models for orienting the user within data collections, particularly where the ability to represent change-over-time is at play?
BA: Networks are inherently dynamic, undergoing constant changes, both within the composition of nodes, and in the relations between nodes. To help you understand how the network changes and behaves over time, Graph Commons provides a timeline interface. It animates your network map as nodes leave and enter the network and the map expands or contracts in time. The network shape, radius, density, intensity, and emergence of clusters, central and peripheral actors all become observable and comparable using the timeline feature.
CM: Networks are the predominant and paradigmatic episteme of the information age. What kinds of relationalities, phenomena, data collections, or texts do they fail to capture? In other words:
a. What the network is NOT suited to do/perform
b. On speculating through an accelerated lens, what will the predominant formal and organisational structure of the next century look like? Will networks continue to play a role, or will they be completely surpassed by new organisational and structural logics?
BA: Bare network mapping may not be sufficient in studying multilayered diverse network dynamics where actors (nodes) and relations (edges) is not clearly distinguishable from one another as in swarms of species or molecular activity. Moreover, at the heart of capturing data lies the question of measurability. If something analogue can be measured it becomes digital, then it can be linked to other data points and become a subject of a network analysis. I think in this day and age, even emotions, intentions, and desires could be measured to a degree, if not socially reproduced.
In a world where every atom can be addressable with an IP address (IP6), discussion of the possibility of capturing analogue things is increasingly less relevant. What becomes critical is the question of who captures and controls what data owned by whom. Do you own a self-driving car’s data captured from your neighbourhood? Are you in control of your data captured by the network medicine? Are you paid rent for the use of data that belongs to you? Data oligarchies will only continue to grow, and this situation of data dispossession will increasingly constitute what I call data asymmetry for many years to come, until we move from connectivity to collectivity, build purposeful exploitation-free autonomous zones, and reroute our life activities in solidarity.
Regarding the future of organizational structures as imagined to be constituted by cryptocurrencies, something clear from today is that decentralization is not necessarily democratic. It should be deliberately discussed that ones who design the protocols have power and network effects can generate inequality. A blind belief in decentralization would not be so different than a belief in free market ideology. When Poland, Chile, and Turkey opened their markets to the world in the 80s, globally networked corporations penetrated into these markets completely within the laws and yet left the small locally connected actors stagnant, this is one example how network effects could generate inequality.